TensorflowJS Model Analyser and Benchmarking Follow Up
The TensorflowJS Model Analyser and Benchmarking is now online, hosted on Neltify. Since the last write up I made some improvements:
- Support for different model types (if it has image input/output, it should work).
- Better model information output, read from the
model.jsonfile. - The ability to toggle image manipulations with OpenCV on the fly.
- Slightly better FPS output - but still an unreliable measure I think.
- WebGL based output to screen.
Most of these are usability improvements. The final point was me grasping the low-hanging fruit hoping it will speed things up, but TL;DR: it didn’t really do much.
WebGL Output to Screen
The TensorflowJS way to convert a tensor to an image to render to the screen is the run the tensor through their toPixels() function. Rooting aroudn in the source code reveals that it works in the old school, serial way of iterating through each data point in the tensor and converting it to an RGB value, appending to an array and then using the HTML Canvas putImageData() to get the data into a canvas element. The function is below - I’ve redacted bits that are unimportant right now, mostly error checking, and all the comments are mine - you can see the full source code here.
export async function toPixels(
    img: Tensor2D|Tensor3D|TensorLike,
    canvas?: HTMLCanvasElement): Promise<Uint8ClampedArray> {
  let $img = convertToTensor(img, 'img', 'toPixels');

  /* ... */

  // Get the data from the tensor. This is the most useful part and
  // will come in handy later...
  const data = await $img.data();
  const multiplier = $img.dtype === 'float32' ? 255 : 1;
  const bytes = new Uint8ClampedArray(width * height * 4);

  // Iterate through the data...
  for (let i = 0; i < height * width; ++i) {
    const rgba = [0, 0, 0, 255];

    for (let d = 0; d < depth; d++) {
      const value = data[i * depth + d];

      /* ... */

      if (depth === 1) {
        rgba[0] = value * multiplier;
        rgba[1] = value * multiplier;
        rgba[2] = value * multiplier;
      } else {
        rgba[d] = value * multiplier;
      }
    }

    // Put the RGBA data into a Uint8ClampedArray
    const j = i * 4;
    bytes[j + 0] = Math.round(rgba[0]);
    bytes[j + 1] = Math.round(rgba[1]);
    bytes[j + 2] = Math.round(rgba[2]);
    bytes[j + 3] = Math.round(rgba[3]);
  }

  if (canvas != null) {
    canvas.width = width;
    canvas.height = height;
    const ctx = canvas.getContext('2d');
    const imageData = new ImageData(bytes, width, height);
    // Hand the image data over to the canvas to display
    ctx.putImageData(imageData, 0, 0);
  }
  if ($img !== img) {
    // NB: explicitly delete the tensor to free memory.
    // This is something to take note of if you want to
    // work more with TensorflowJS.
    $img.dispose();
  }
  return bytes;
}
None of the TFJS examples output to video like I’m trying to do, so if all you want to do is generate static images from your model, the method above works fine. But I do want to output to video so generating each frame pixel-by-pixel is a bit slow. So I then wrote a small shader program with WebGL which takes the data from $img.data() and passes it to a fragment shader as a texture. The code can be seen here.
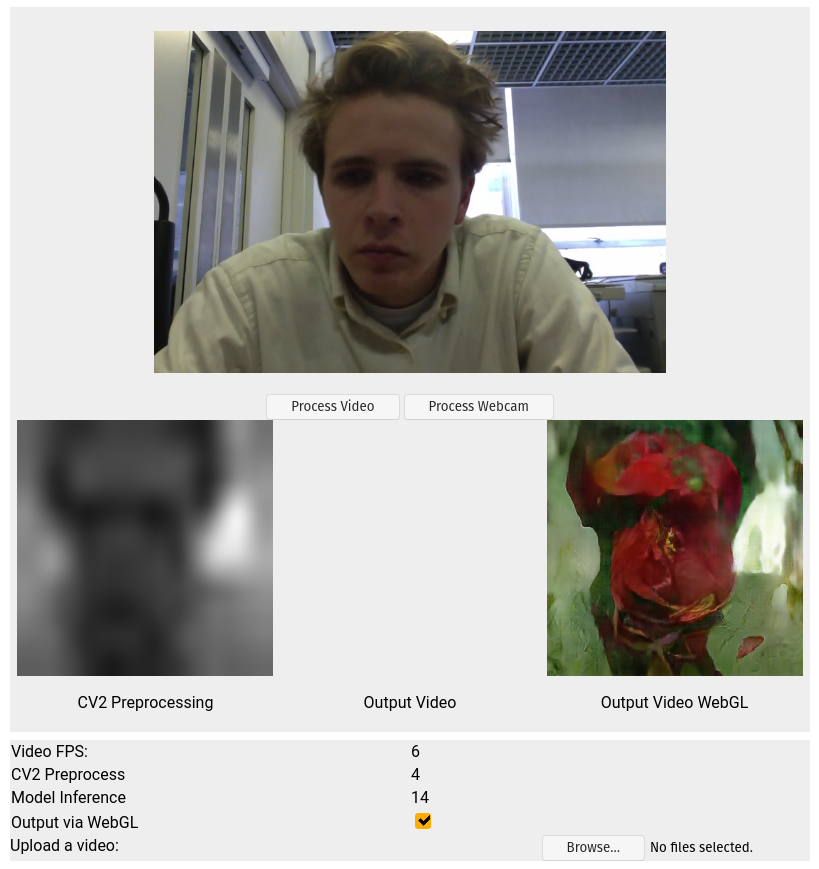
As you can see in the video below, you can switch between the normal TFJS toPixels() method, or to my WebGL based method. You can also see the switch to WebGL improves the FPS by maybe 1. I haven’t done much rigourous testing but this marginal gain is not really worhth writing home about. The demo below is running on an Nvidia RTX 2070 graphics card.
My theory as to why the gains are so marginal is down to the fact that you still have to get the data in to the shader program: the data needs to be copied from the tensor, into a buffer and then sent into the shader every frame. Something that comes up often when it comes to writing optimal WebGL code is the avoid WebGL API calls whereever possible. This amounts to grouping commands and computations into more concise blocks at a higher level (see here).
Using a profiler such as the Firefox Profiler reveals a bit more about what is happening, and which parts of the pipeline are using resources.
I’ve spent a fair amount of time scrubbing through the stack trace (and you can too if you want!) and I’m not going to claim to fully understand what’s going on. I don’t know enough about the Javascript engine to know exactly how it handles callback, async/await functions and requestAnimationFrame calls etc. I think these kinds of things are why it appears to run the model twice before calling for a re-paint. I’ve annoted the images below withg roughly what I think is going on, the time in the top left shows approximately how long that range represents as well (approx because the it’s not a perfect slice of a single draw loop).
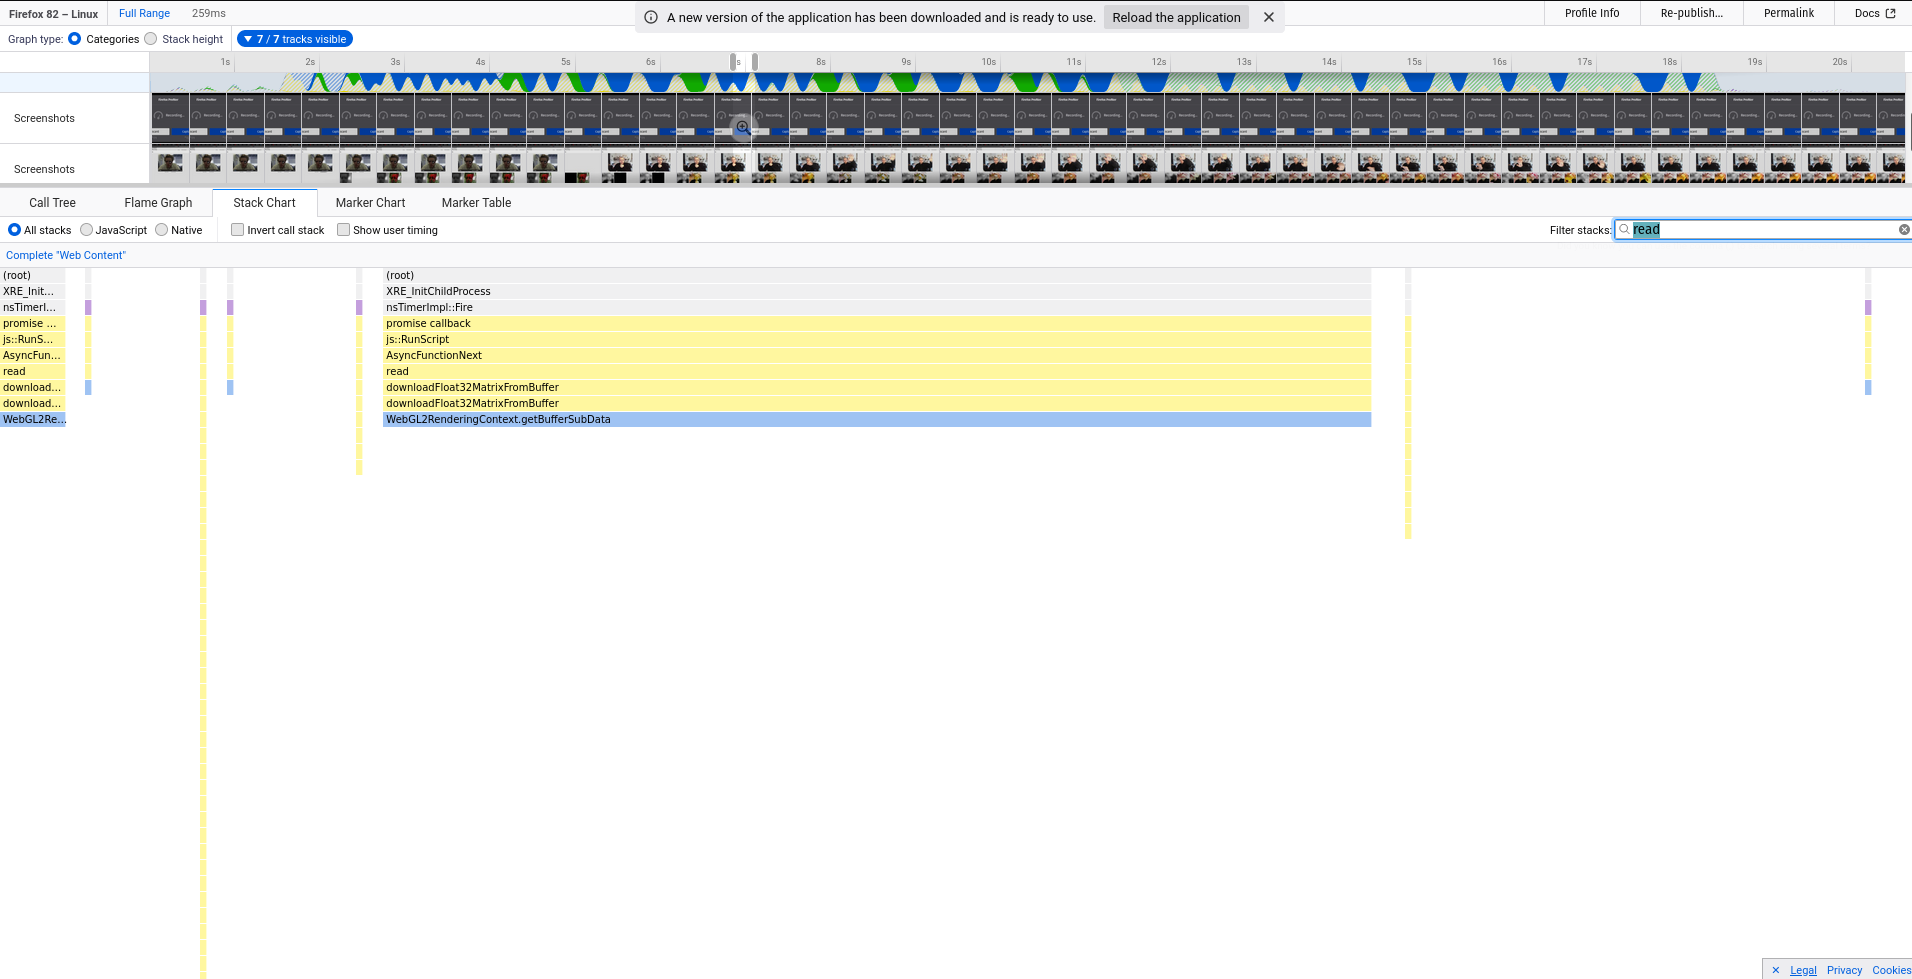
Below is the stack trace for the toPixels() method of rendering which takes about 259ms:
![]()
Where is says Read data from somewhere… the function call comes from a MathBackendWebGL object which read()’s data from a data texture, hence the WebGL API call to getBufferSubData(). I am not sure if this long stretch of time is the JS engine catching up on a bunch of callback, as the read() function itself is an async function. The image below filters for that read() function, and you can see it appears a few times when the model is running:
Either way I do know that that is a costly WebGL API call and so it’s not surprising it is a time-hog. For those curious, here is the function which actually does the data fetch, called asyncronously from MathBackendWebGL.read():
function downloadFloat32MatrixFromBuffer(gl, buffer, size) {
    const gl2 = gl;
    const downloadTarget = new Float32Array(size);
    gl2.bindBuffer(gl2.PIXEL_PACK_BUFFER, buffer);
    gl2.getBufferSubData(gl2.PIXEL_PACK_BUFFER, 0, downloadTarget);
    gl2.bindBuffer(gl2.PIXEL_PACK_BUFFER, null);
    return downloadTarget;
}
Below is the stack trace for the WebGL output method which takes about 194ms:

You can see the stack trace is generally quite different; far fewer Javascript function calls, and a lot more work coming from the graphics engine (green bars). Generally this should be a good thing, but it’s also quite clear that it is still a fair amount of time consumed by the graphics engine. Perhaps this is because of the time it takes to get the data into the shader program, run it and then connect to the canvas as output.. I’m not too sure.
The timings vary as it runs, so the timings listed above are not really indicitave of the overall performance difference.
Model Size
Using Auto-Pix2Pix (a tool a developed to help rapid prototype Pix2Pix style models for this project) I developed a few different models of varying sizes to see what difference that made to performance… TL;DR: it didn’t do much.
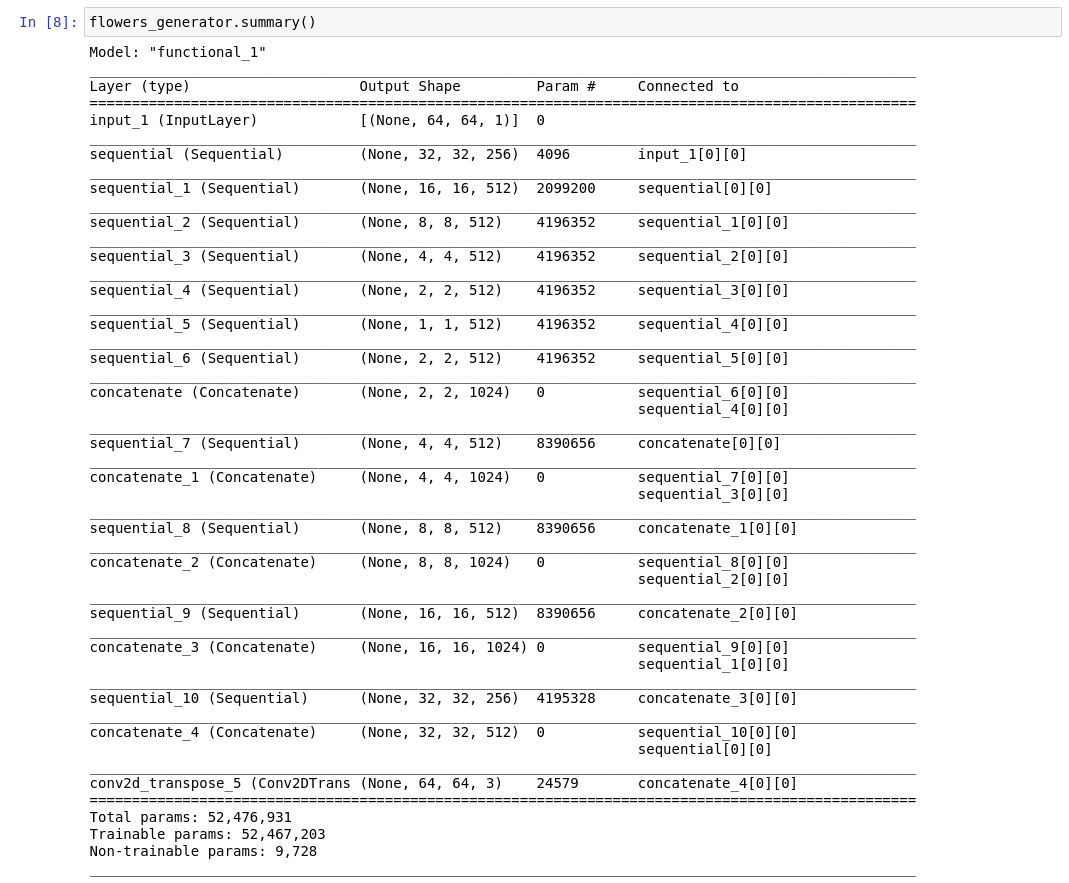
But this isn’t at all surprising when you actually inspect the model. Here is the summary for a model with input size of 128x128 (half the size of what is used in the demos above):

If you look at the Param # column, you’ll see that the majority of the trainable parameters are in the inner layers. This was a bit of a ‘ooooh I think I get how CNNs actually work now’ kinda moment for me. The graphic which accompanies the article about Pix2Pix on AffineLayer helps explain furthur:
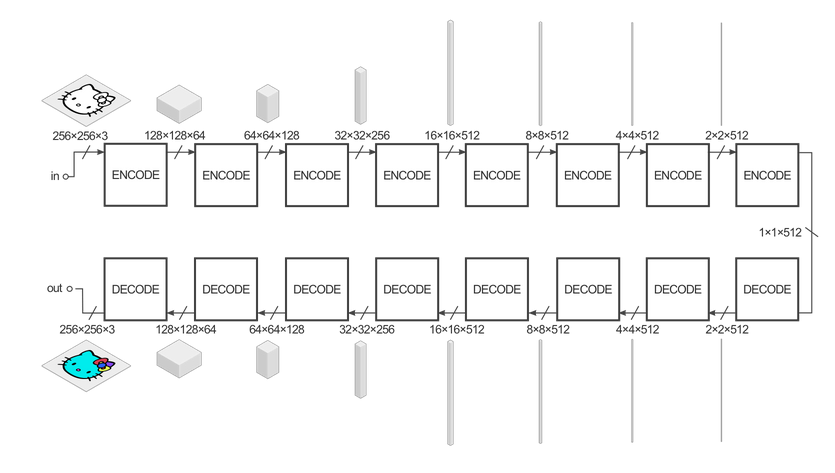
As the data is reshaped as it moves through the encoder/decoder (which is the generator), the depth of each tensor corresponds to the number of filters of the previous layer. And each filter must have the same depth of the incoming tensor. So the number of trainable parameters (the weights in the convolutional kernals) compounds as the tensors are reshaped from layer to layer.
This is seen again for a model of input/output dimensions of 64x64:
So running one of these “smaller” models in the browser doesn’t really change that much. A better change in the architecture would be to reduce the number of filters used each layer. This is still something to try… BRB.